Dynamic Collision Reports product review
Project Dashboard
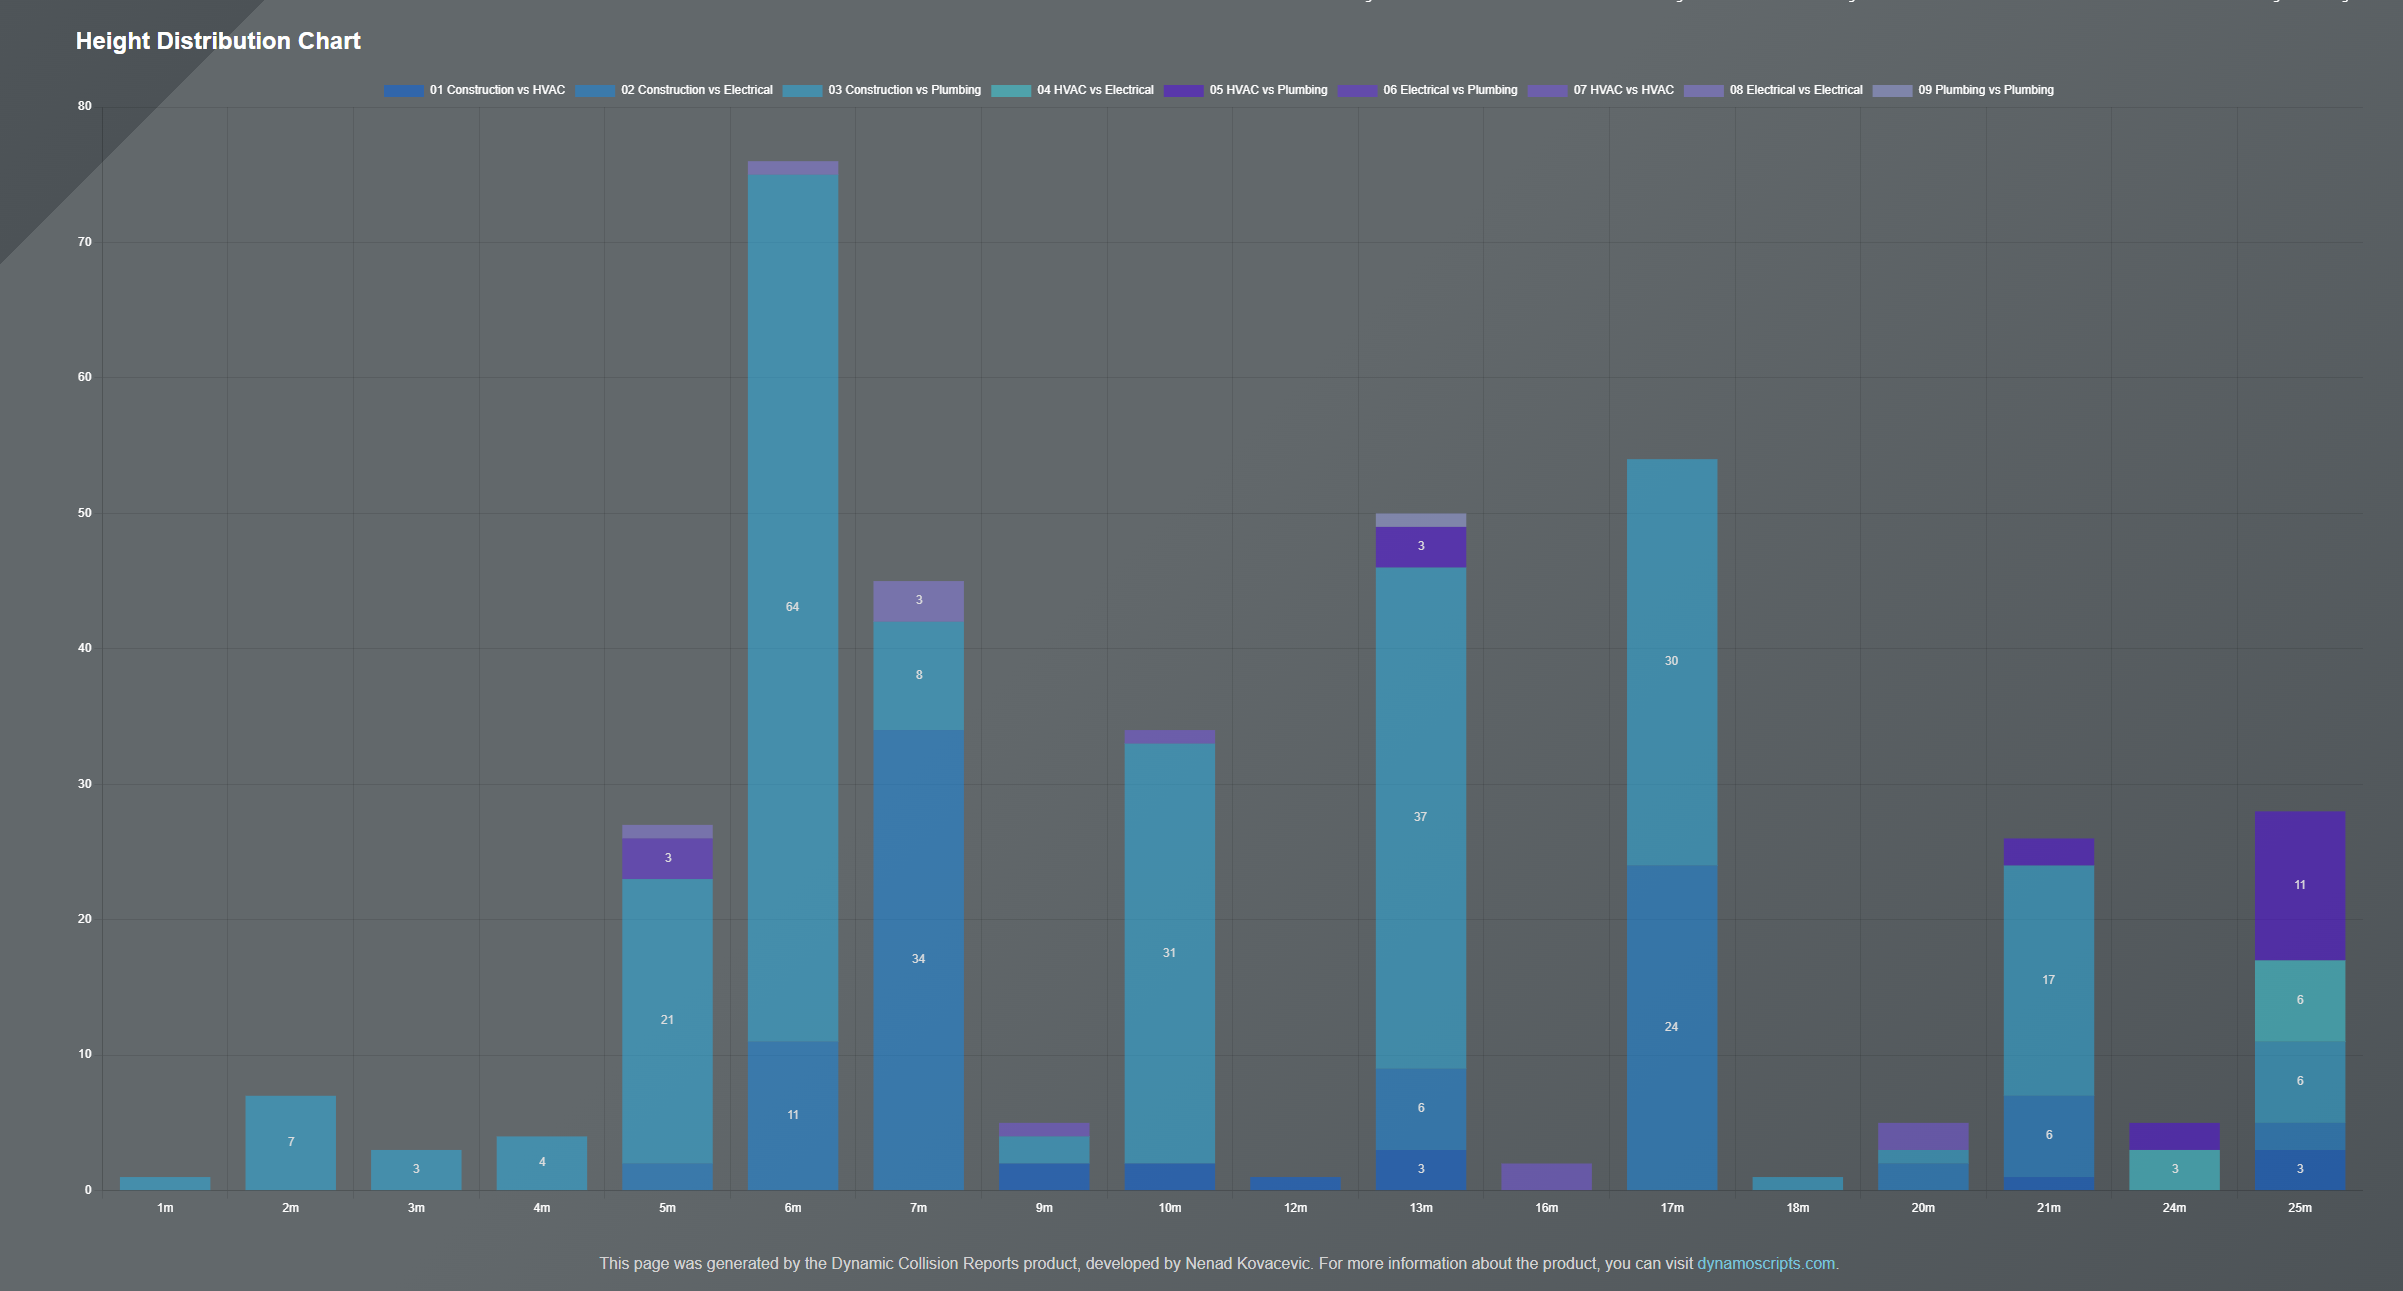
The first part of the tool will create a project dashboard where you can view the number of collisions in both table and chart formats. The charts will show the total number of collisions and also the number of collisions per project height.
Dynamic Reports
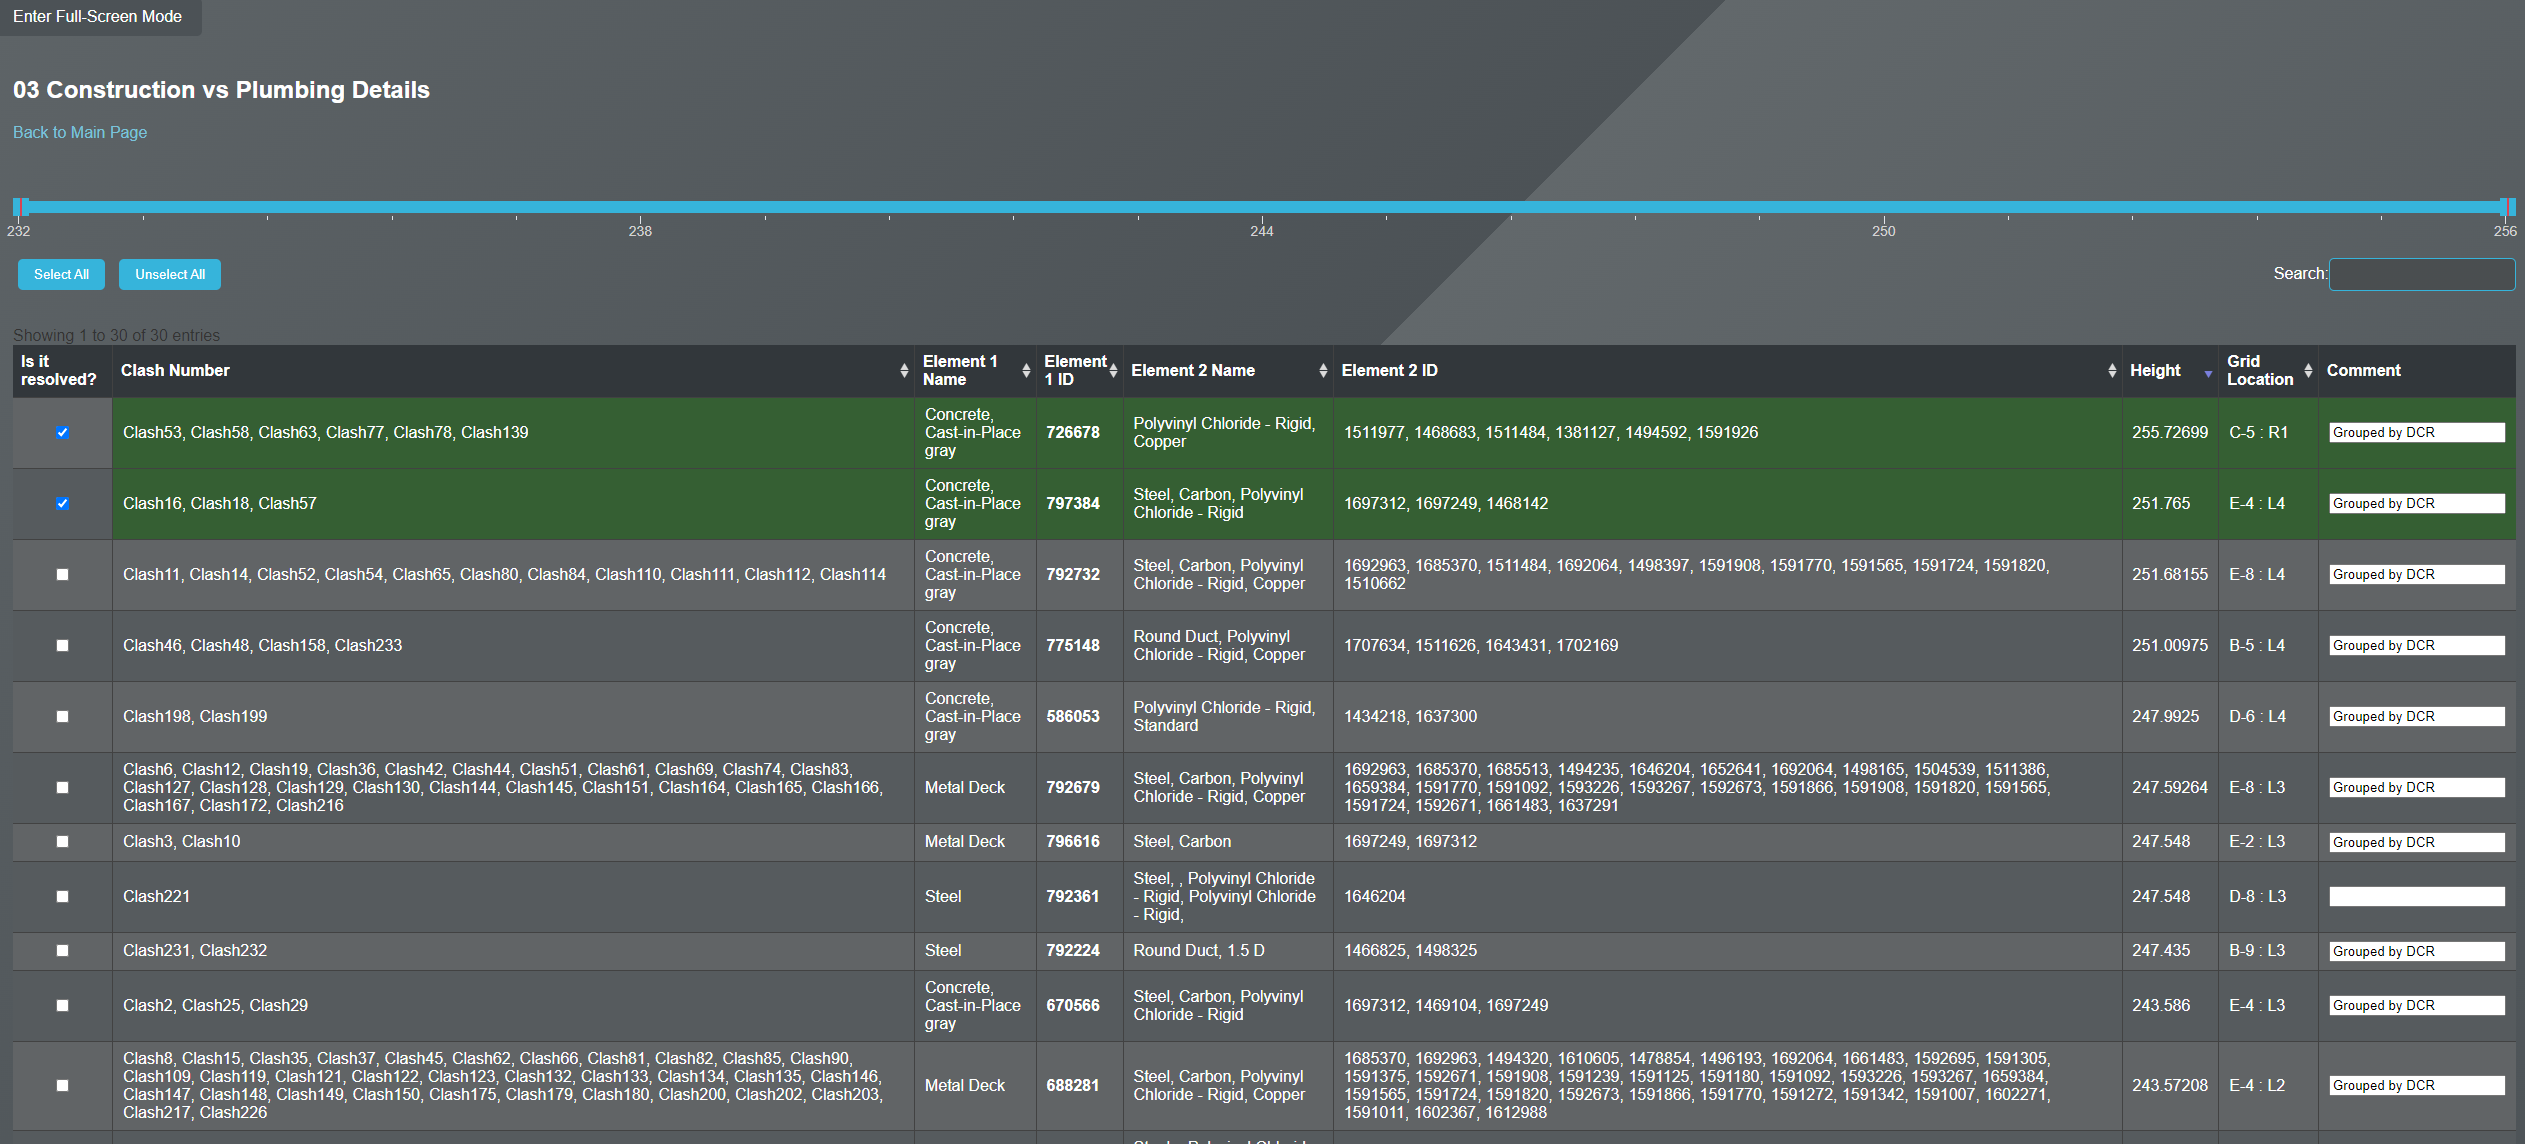
The second part of the tool consists of dynamic reports for each clash test. There is a link on the main page to all clash test pages, so it is not necessary to manually search for reports. Some of the features included in the reports are:
| Feature | Description |
|---|---|
| Filter Collisions by Height Slider | The possibility to quickly filter collisions by building height. |
| Built-in Tool Logic | Built-in tool logic that will remove clash tests that do not have collisions. |
| Group Collisions Automatically | The tool will automatically group collisions by the first element, populating the Comment field with relevant details if one element creates multiple collisions. |
| Easy Collision Filtering | By using the search button, we can easily filter collisions based on specific element attributes. |
| Mark Resolved Collisions | When resolving a collision, a checkbox can be used to mark collisions as resolved, automatically highlighting the entire row. |
| Comments | Users can populate the comments field with a comment for that collision. |
| Save Changes Automatically | Upon exiting, the browser saves changes, making them visible the next time the same page is opened, allowing continuation from where the user left off. |